Experiment Statistics for Monitoring
Monitor Gateway Traffic
- Monitor current gateway experiment and job statuses through Settings → Experiment Statistics.
- Gateway admin can view and filter experiments using this page.
- To view individual experiments one can use
- Experiment ID search
- Job ID search
- In Experiment Statistics page, by default, the gateway status for last 24 hours will be displayed.
- Two buttons, 'Past 24 Hours' and 'Past Week' will group and list the experiments for the selected time.
- In order to further filter the experiments use, Filters.
- Username: AnneMarie (Gateway username need to be typed in)
- Application Name: Gaussian16 (All the application in teh gateway will be listed)
- Hostname: Expanse (A drop down will provide all the compute resources to select)
- Click 'Get Statistics'
- Using the calendar, you can search experiments for a specific time.
- Once the experiments are filtered and grouped, click on the desired group (Existing experiments groups are 'Total','Created','Running', Completed','Cancelled' and 'Failed').
- When you list an experiment group you can select the experiment you want to view using 'View Details'.
- This will open the experiment Details in a new tab.
- In the page, you can view
- Experiment status
- Job status, job ID and name
- Job script
- Remote working directory path
- Experimental data directory path
- All the experiment launch and job submission tasks, their details, statuses
- If any error messages
- Responses from remote resource
- Experiment statistics is mainly useful to investigate experiments and jobs users report issues.
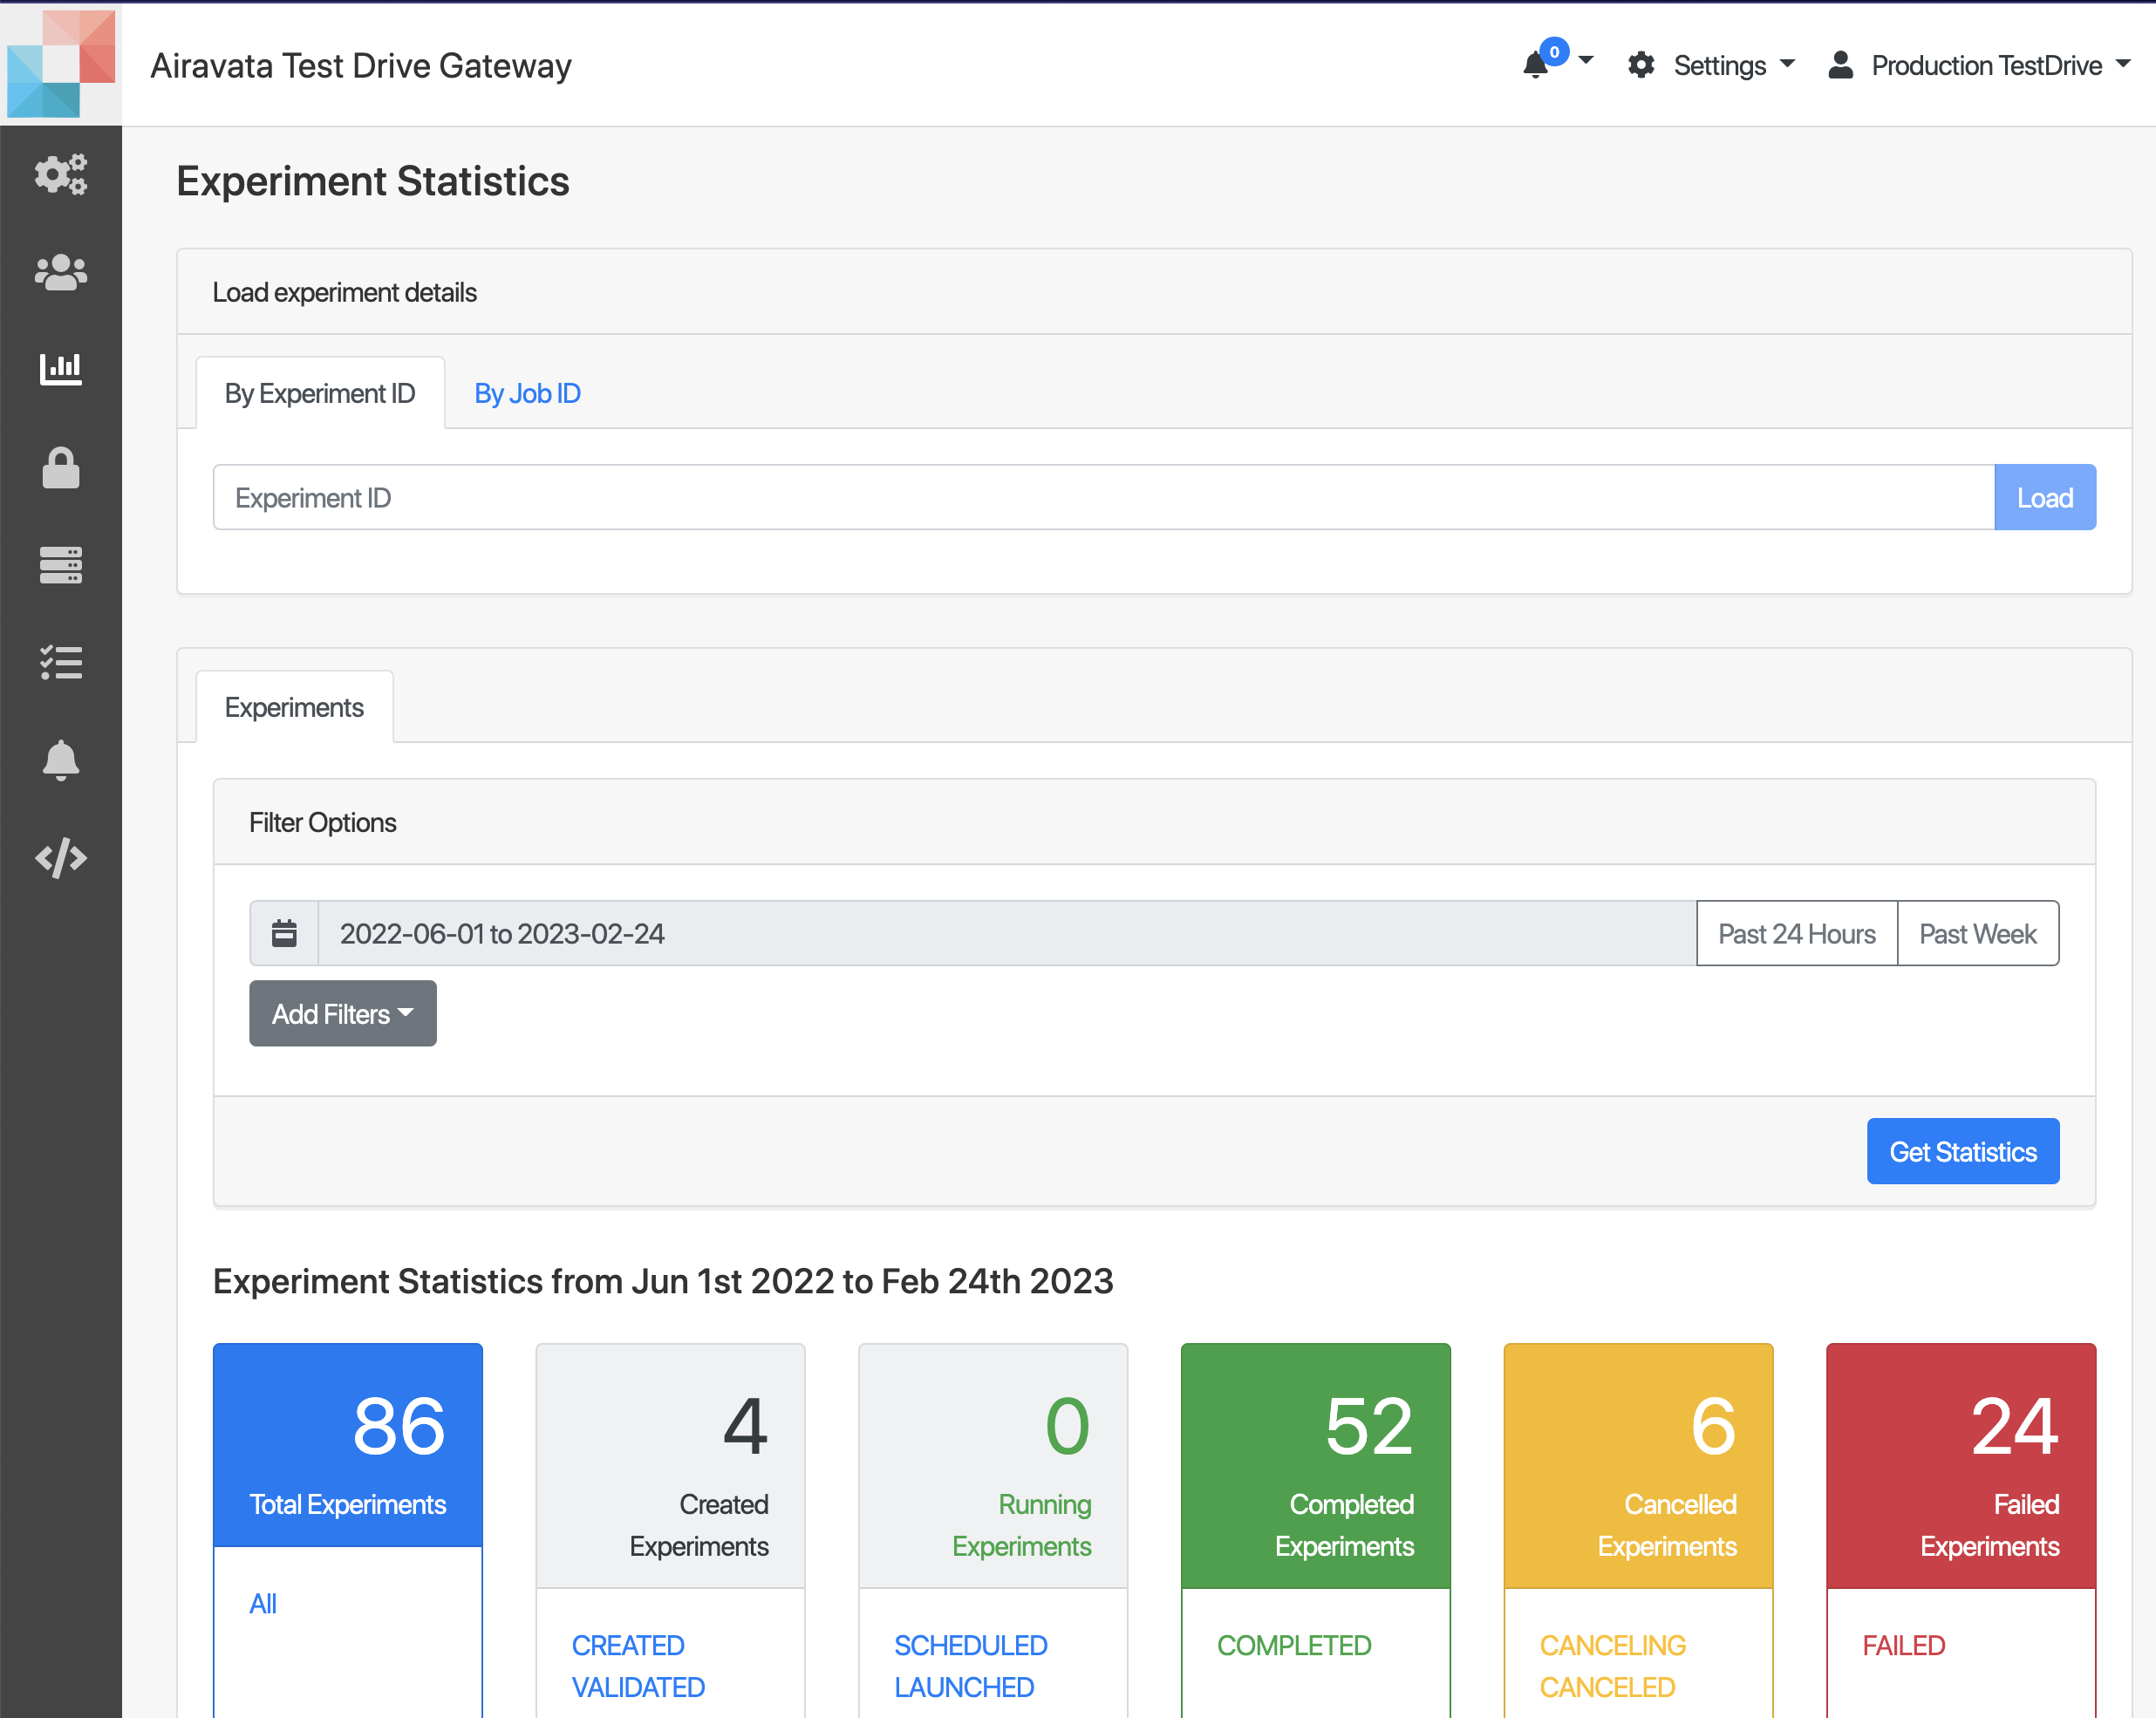 Image:Experiment Statistics
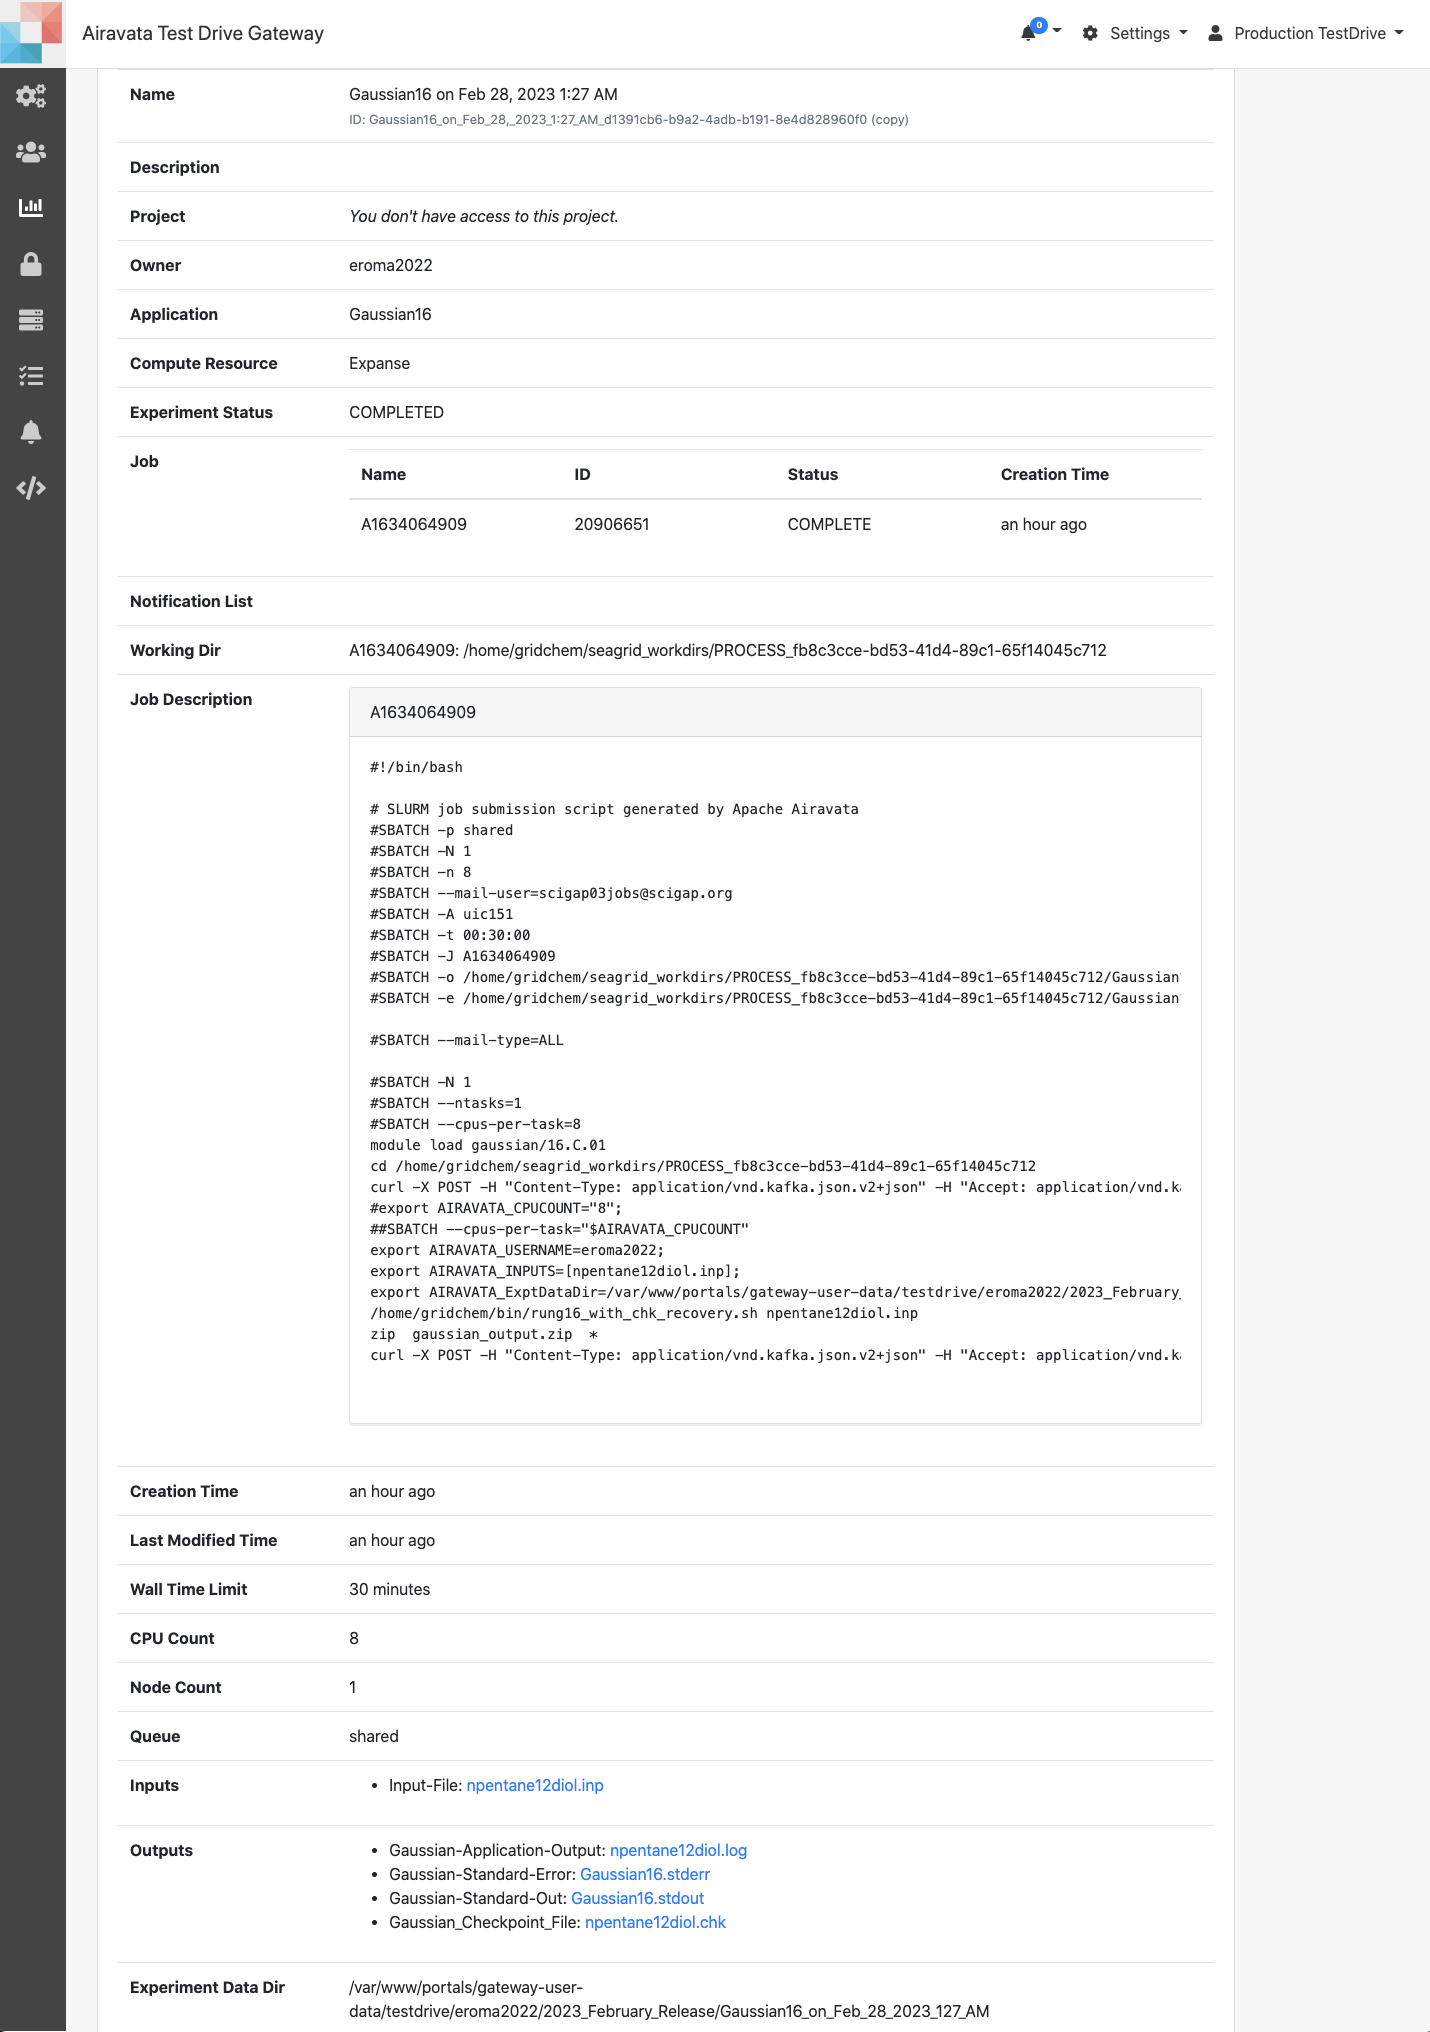 Image: Experiment Details